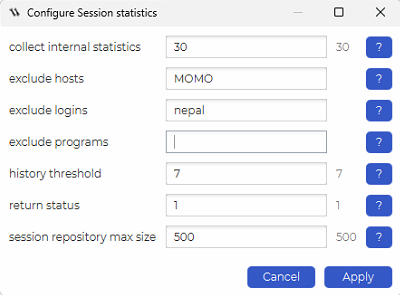
Configuration & parameter descriptions
| Parameter | Default | Sqltype | Description |
|---|---|---|---|
| history threshold | 7 | 5 (integer) | The maximum number of day to kept statistics for in the historic tables. |
| collect internal statistics | 30 | 5 (integer) | How often (in minutes) size of internal objects should be checked. “Session statistics” job collects a large amount of data in the dbWatch schema tables, so it is important to keep track of space usage in the dbWatch database. |
| return status | 1 | 5 (integer) | Return status value (ALARM – 2, WARNING – 1, or OK – 0) when reached maximum space consumption (parameter “Session repository max size”) . |
| session repository max size | 500 | 5 (integer) | Maximum space consumption (in MB) for internal/repository objects that contain session statistics. |
| exclude logins | 0 (text) | List of logins to be excluded. | |
| exclude hosts | 0 (text) | List of hosts where sessions will be excluded from statistics collection. | |
| exclude programs | 0 (text) | List of programs where sessions will be excluded from statistics collection. |
Example configuration
Example
The selected (blue) row represents one specific SQL Server session that is currently or was recently active.
In the Sessions statistics table, the highlighted session shows:
DB: StackOverflow2013
The database against which the session is executing.
PROGRAM: Microsoft SQL Server Management Studio
Indicates the session was initiated from SSMS.
LOGIN: sa
SQL Server login used by the session.
HOST: OFFICE
Client machine where the session originated.
CMD: SELECT
The command currently executed by the session.
dbWatch tracks how long the session has been active using history timestamps:
FIRST HIST: 04:20:33
When dbWatch first observed this session.
LAST HIST: 04:25:32
The most recent observation of the session.
ELAPSED TIME: 305,939 ms
Total duration the session has been active (just over 5 minutes).
In dbWatch terms, this is a long-running session.
CPU Consumption
CPU TIME: 828 ms
In dbWatch, CPU TIME represents how much processor time the session actually consumed.
Since CPU TIME is very low compared to ELAPSED TIME, dbWatch indicates that the session is not CPU-bound.
I/O Activity (dbWatch Metrics)
The session shows the following I/O values:
IO READS: 0
IO WRITES: 11
LOGICAL READS: 39,353
Interpretation using dbWatch terminology:
-Logical reads are high → large amount of data processed in memory
-Physical I/O is minimal → data is mostly cached
This pattern typically points to table scans or inefficient access paths
What dbWatch Helps You Identify Here
Using Sessions performance and Sessions statistics, dbWatch makes it easy to spot sessions that:
-Have high elapsed time
-Have low CPU time
-Generate many logical reads
-May be waiting on I/O, locks, or inefficient query plans
This session is a classic dbWatch example of a query that:
-Looks harmless from a CPU perspective
-But still impacts overall system performance due to duration and data access volume
-Typical dbWatch Follow-Up Actions
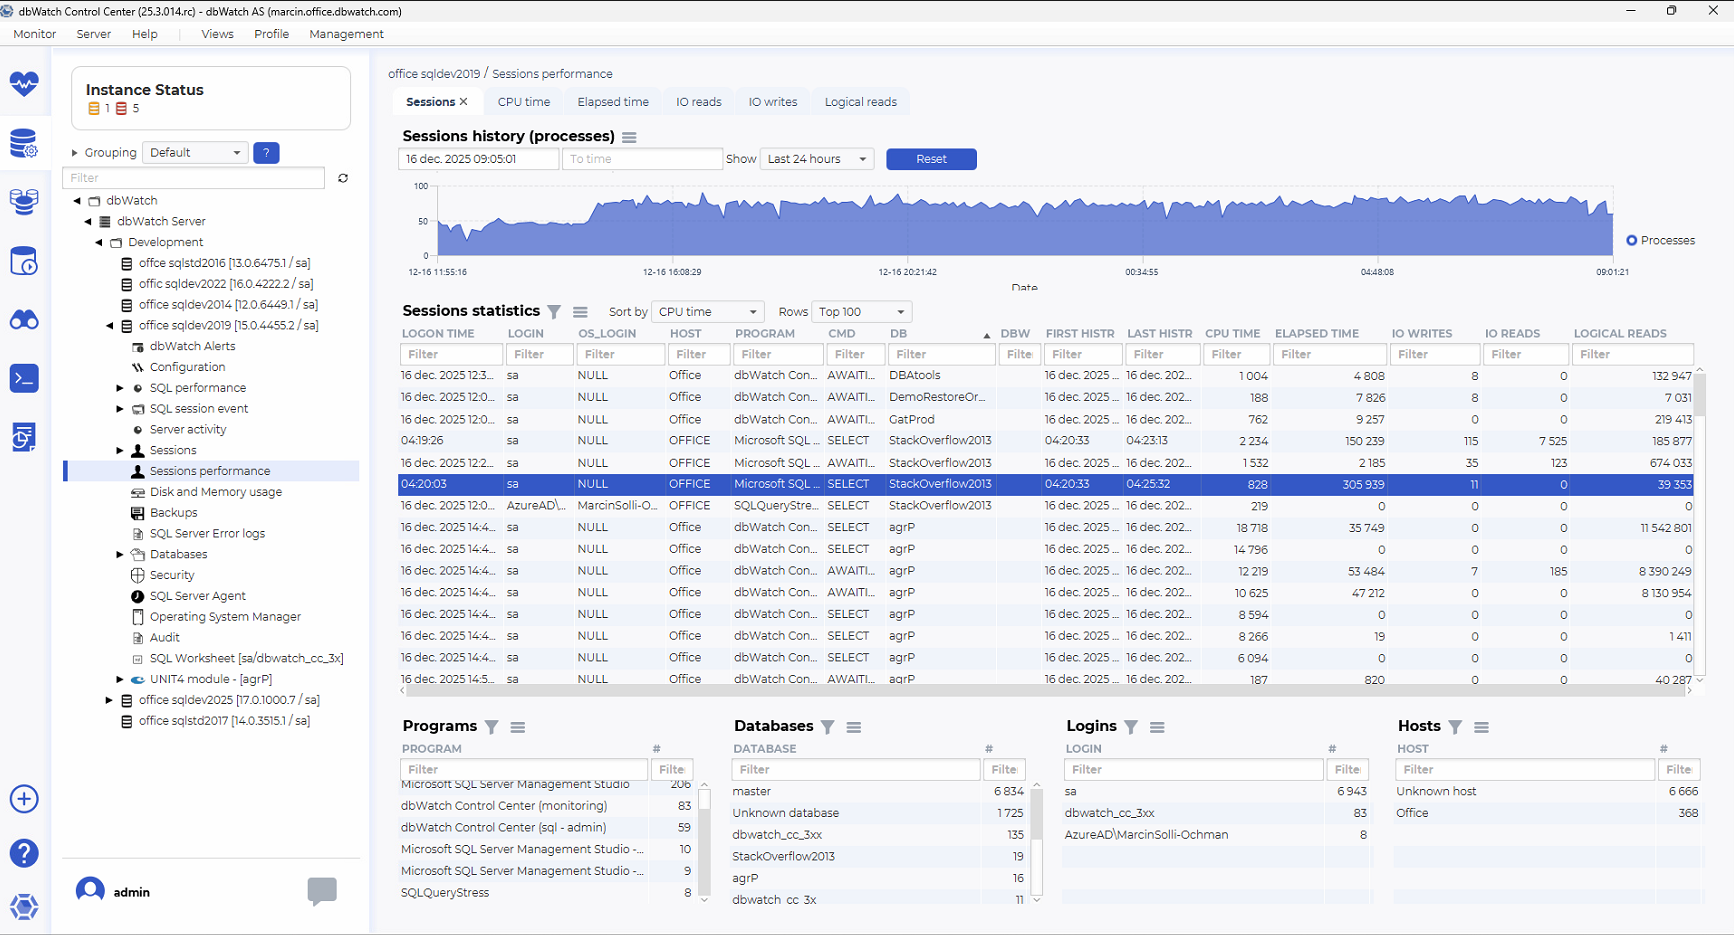
From this view, a DBA would typically:
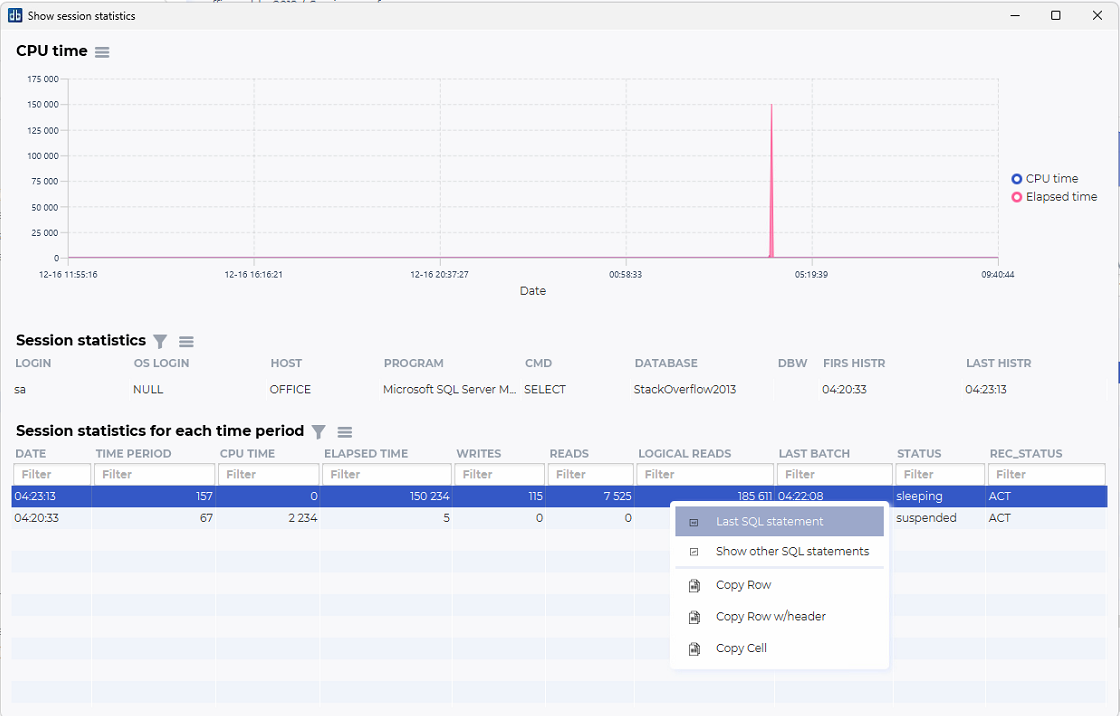
-Drill into Session activity
-Drill into Session statistics for each time period to se the query.
 -Correlate with SQL performance for execution plans
-Review Indexes and statistics on StackOverflow2013
-Determine whether the session is expected or needs optimization
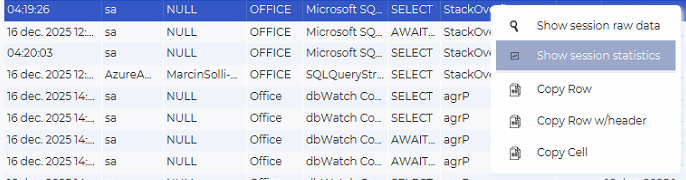
Context menu actions (Programs, Databases, Logins, Hosts)
Right-clicking items in the Programs, Databases, Logins or Hosts overview provides useful shortcuts:
Show CPU usage
Displays CPU usage history for sessions tied to the selected item.
Show sessions history
Filters the session history graph and session table to show only sessions related to the chosen program/database/login/host.
Used databases
Shows which databases were accessed by the selection.
Used hosts
Shows which hosts were involved for a selected program or login.
Used logins
Reveals which SQL logins are associated with the selected program or host.
Copy Row / Copy Row w/header / Copy Cell
Utility functions for exporting table data to spreadsheets, logs or documentation.
See also
Adding EVENT SESSION functionality